| Return to Main Page | Weashington, IL tornado outbreak analysis | Temperature and dewpoint data for Cut Bank, MT | Useful Weather Links | My Weather photos |
|---|
| large and Synoptic scale pattern | Conclusion of the case study | Case study prep lab |
|---|
1. Introduction
On November 17th, 2013, a significant severe thunderstorm and tornado outbreak occurred over Illinois, Indiana, Ohio, Michigan, and a few other surrounding states. The cities of East Peoria, IL, Washington, IL, New Minden, IL, and Shady Grove, IL were devastated by strong tornadoes early on in the day. Later on in the day, Gifford, IL would also be hit by a strong tornado, as well as several others that where hit in the state of Indiana. The vast majority of the remaining storm reports was damaging wind gusts. This was the most common type of damage outside of the tornado damage.
The storms began forming around 15Z (9 am) on Sunday morning, and continued throughout the rest of the day. As the convection began to form, the initial mode of development was of supercells. However, due to significant unidirectional shear, the storms shifted into a QLCS, or a quasi-linear convective system. The highest directional shear was in the lowest 100 hPa of the atmosphere. This caused the storms to rotate and become tornadic very rapidly, even with the time of the day. (figure 1) On Saturday November 16, an area of low pressure began to form on the lee side of the Colorado Rocky Mountains. As the low pressure began to push eastward, it began to deepen rapidly. At the same time, the low pressure had moved into the left exit region of a jet. This helped to rapidly strengthen the low as it moved to the northeast. A trailing cold front formed soon after, along with a warm front.
The warm front pushed northward through the central plains and western Illinois, causing a surge in the dewpoints and temperatures. (figure 2) This helped to increase the instability, even in the early morning hours of that Sunday. The cyclone was at its strongest at 6Z Monday or about Midnight Monday morning, with the pressure of the low pressure getting down to 972 hPa. By 9Z on Tuesday, about 3 am, the associated occluded front with the cyclone fell apart. (Weather Prediction Center) There were over 500 reports of severe weather, including 73 tornadoes. The rest of the reports were damaging wind gusts and large hail. (Storm Prediction center) 5 people ended up losing their lives, and over 150 were injured in the storms.
2. ImpactsThere were over 500 reports of severe weather events during the event. 73 of those were tornadoes. (figure 3) 30 of these tornadoes occurred in Indiana, which is second for the state in single day tornado reports. (NWS Northern Indiana) A good majority of these tornadoes happened as or after the storms congealed into a QLCS-type squall line. The strongest tornadoes of the day were a pair of EF-4 tornadoes. The first one struck Washington, IL in central Illinois. The other struck New Minden in South Central Illinois. (NWS Chicago) There were also some extreme storm reports. There was 4 inch, or softball, sized hail in the city of Bloomington. There were other instances of large hail, with baseball (2.75 inch) sized hail in Normal and in Assumption. There were also several instances of extreme wind gusts outside of tornadoes. The highest damaging straight line wind gusts occurred in three locations, as each had a wind gust of 85 mph. The locations were Crown Point and Swayzee, IN and Bowling Green, OH. There were several other instances of destructive wind gusts above 75 mph, mostly in the Chicago area, and a few others scattered through Illinois, Indiana, and Ohio. (NWS Storm Prediction Center) Some mail from Washington that was picked up into the tornado ended up falling 100 miles to the northeast in Channahon, IL (Peoria Journal Star) The updrafts from this storm kept some of the debris that the Washington and East Peoria tornadoes suspended in the storm, and this is why the debris ended up falling in northeastern Illinois. Other debris that was captured by the radar aloft was found dropped up to 100 miles away from the storm as well.
Figure 1- This is an image of the NEXRAD 1km radar mosaic at 11:27 am (1727Z) on the 17th. The strongest of the storms have the bright reds and the white cores, with the lighter rain being the green and yellow colors. The supercell thunderstorms are, at that point, paralleling the Interstate 55 corridor. Of note is the linear nature to the convection. This would, later, enhance the storms capability to produce damaging wind gusts. It would also cause the storms to form into more of a QLCS type storm. (College of DuPage's NEXLAB via UCAR's Image archive)
Figure 2- This is a plot of the dew point temperatures in Fahrenheit at 15Z (9 am) on the 17th with a contour interval of 5, annotated with the approximate positions of the fronts at the same time. Of note is the surge of 60-degree dew points into most of the state of Illinois. This gave the atmosphere plenty of moisture to work with for the development of thunderstorms. With the shear that I had mentioned previously, the aforementioned storms rapidly became severe in the morning hours.
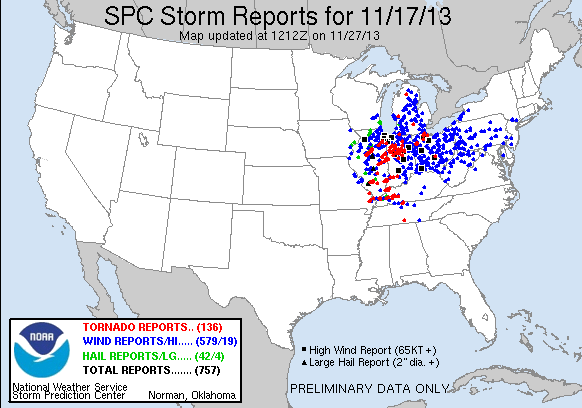
Figure 3- This is a map that depicts the storm reports on November 17th. The red dots are the tornado reports. The blue dots are the damaging wind reports. The green dots are the hail reports. Of note are the several small black boxes around Chicago. This is where there were high wind gusts associated with the squall line that had formed from the initial supercell thunderstorms. (SPC)
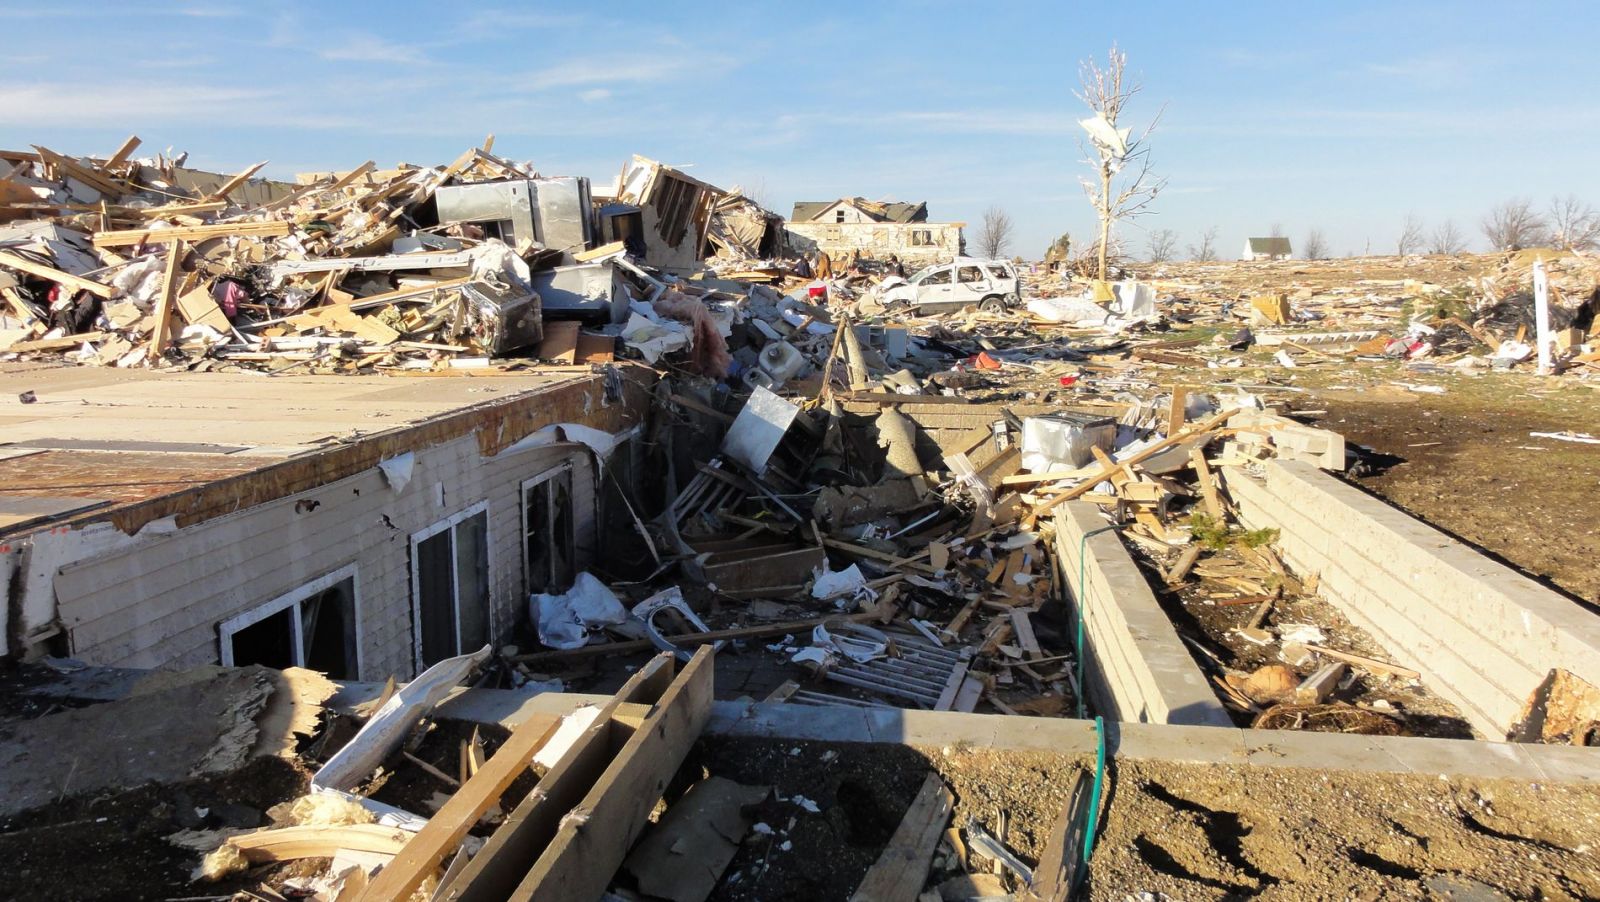
Figure 4a- This is an image of the damage in the city of Washington following the tornado. This was the strongest storm that day, and it produced many miles of damage. This was the first storm that produced damage that day but was not the last. (NWS Lincoln)
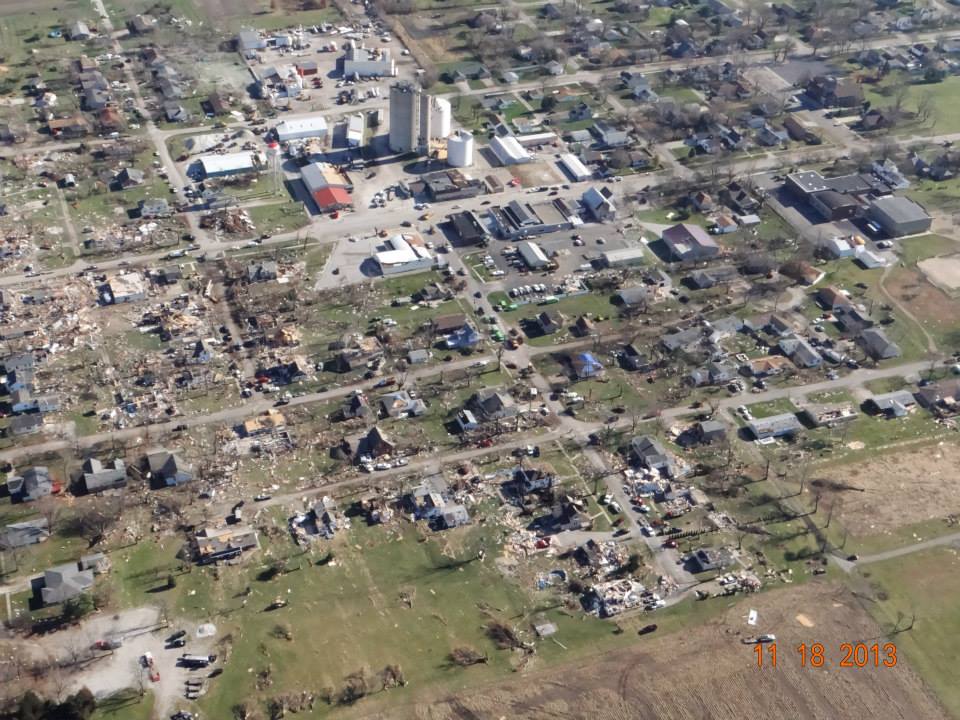
Figure 4b- This is an image of the damage from the storm that hit Gifford from the air. The damage path is visible on the bottom left corner of the image. This storm was much shorter lived than the Washington storm, but was moving at a faster forward speed. (NWS Lincoln)
Video 1- This video depicts the storms as seen through the cameras of Skip Talbot. This shows the evolution of the storm as the storms. Of note, he mentions the llj (lower level jet stream). It would help to strengthen the storms, and to help with the rapid movement of the storms. This storm he was chasing hit the city of Lincoln, IL. (Skip Talbot's youtube)